UPSC CSE Statistics for Civil Services Exam 1992–2026: Vacancies, Applications, Prelims, Mains and Final Selection
The Union Public Service Commission (UPSC) Civil Services Examination is one of India’s most competitive recruitment examinations. Every year, several lakh candidates apply for the examination, but only a small proportion progress through the Preliminary Examination, Main Examination and Personality Test to receive a final recommendation.
How many candidates apply for the Civil Services Examination every year? How many actually appear in Prelims and Mains? How many vacancies are announced? How many candidates are finally recommended for appointment?
This article presents a historical analysis of UPSC CSE statistics from 1992 to 2026. It examines vacancies, applications, attendance, qualification at different stages and final recommendations using official government sources.
UPSC CSE Statistics – Number of Vacancies 1992-2012
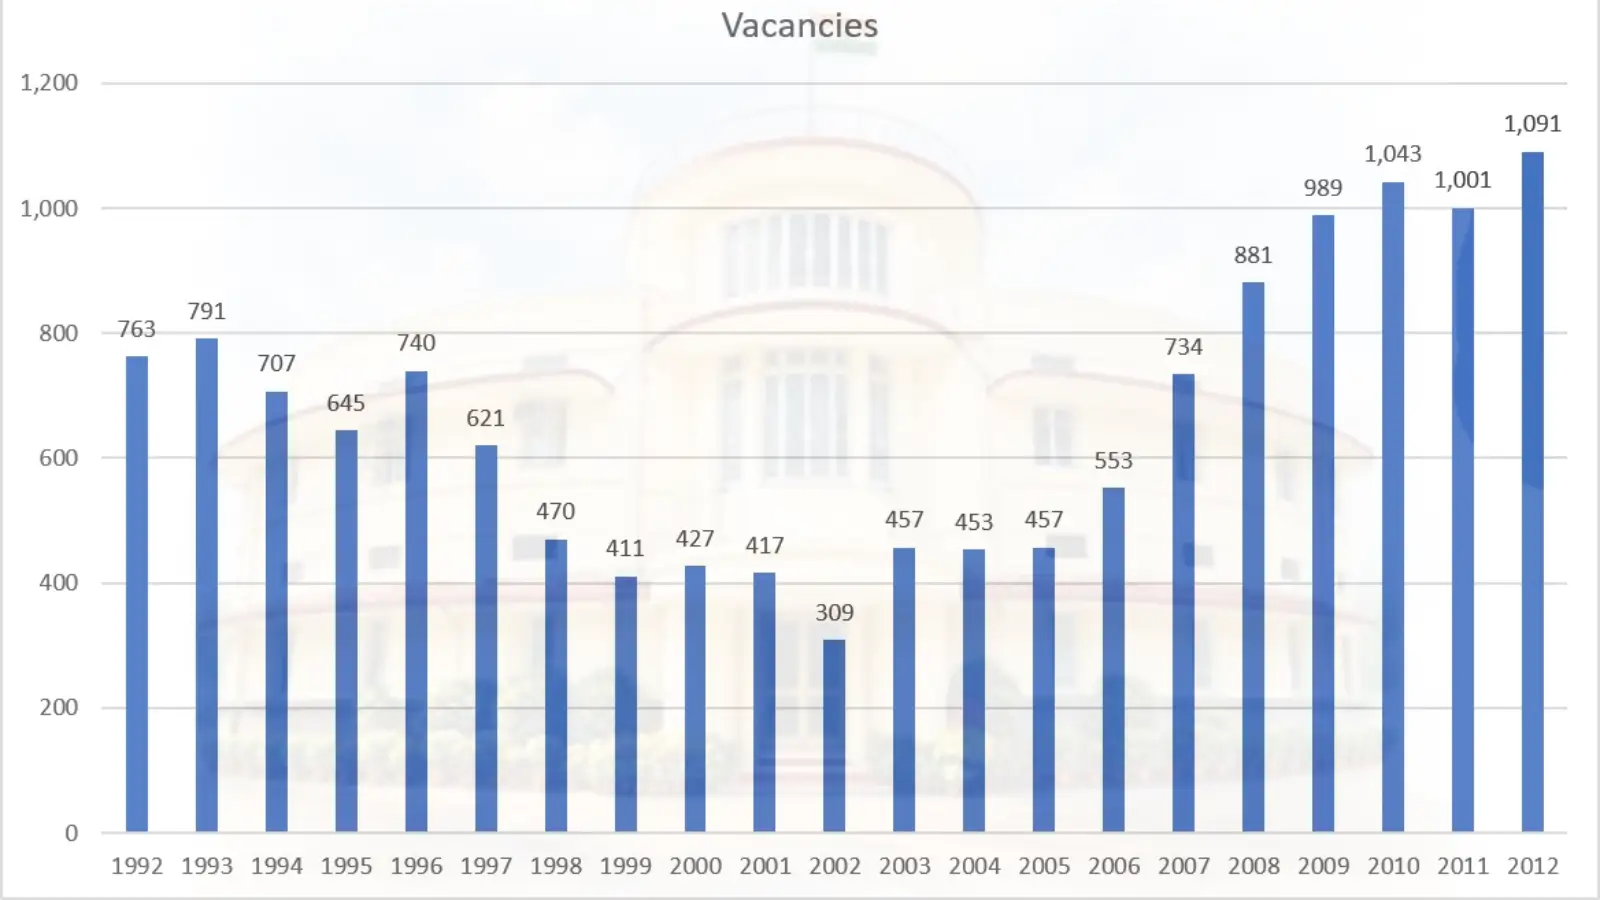
| Year | Vacancies |
|---|---|
| 1992 | 763 |
| 1993 | 791 |
| 1994 | 707 |
| 1995 | 645 |
| 1996 | 740 |
| 1997 | 621 |
| 1998 | 470 |
| 1999 | 411 |
| 2000 | 427 |
| 2001 | 417 |
| 2002 | 309 |
| 2003 | 457 |
| 2004 | 453 |
| 2005 | 457 |
| 2006 | 553 |
| 2007 | 734 |
| 2008 | 881 |
| 2009 | 989 |
| 2010 | 1,043 |
| 2011 | 1,001 |
| 2012 | 1,091 |
UPSC CSE Statistics – Number of Vacancies 2013-2026
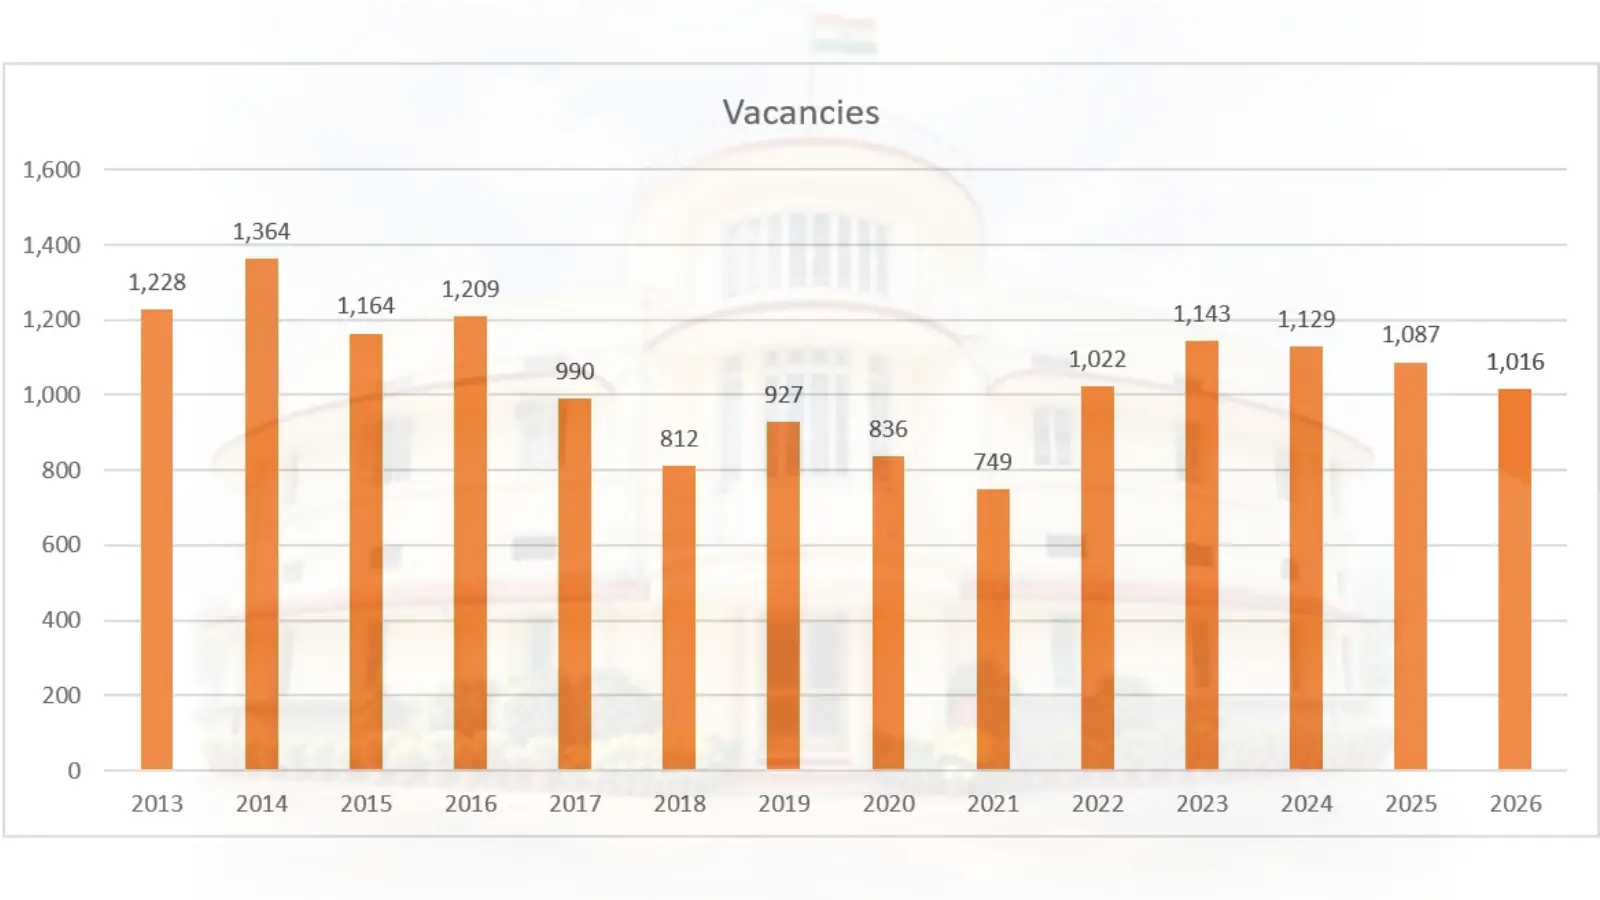
| Year | Vacancies |
|---|---|
| 2013 | 1,228 |
| 2014 | 1,364 |
| 2015 | 1,164 |
| 2016 | 1,209 |
| 2017 | 990 |
| 2018 | 812 |
| 2019 | 927 |
| 2020 | 836 |
| 2021 | 749 |
| 2022 | 1,022 |
| 2023 | 1,143 |
| 2024 | 1,129 |
| 2025 | 1,087 |
| 2026 | 1,016 |
UPSC CSE Statistics: Candidates Appeared in Prelims, Mains, Interview 1997 to 2012
| Year | Vacancies | Applied | Prelims Appeared | Qualified for Mains | Mains Appeared | Qualified for Interview | Initially Recommended |
|---|---|---|---|---|---|---|---|
| 1997 | 621 | – | – | – | 8,125 | 1,265 | 621 |
| 1998 | 470 | – | – | – | 8,789 | 964 | 470 |
| 1999 | 411 | – | – | – | 4,718 | 845 | 411 |
| 2000 | 427 | – | – | – | 4,725 | 874 | 427 |
| 2001 | 417 | 2,09,281 | 1,14,209 | 5,442 | 5,244 | 1,140 | 417 |
| 2002 | 309 | 3,01,585 | 1,57,486 | 3,430 | 3,301 | 748 | 309 |
| 2003 | 457 | 3,16,496 | 1,60,784 | 5,898 | 5,750 | 1,176 | 457 |
| 2004 | 453 | 3,49,020 | 1,74,475 | 5,565 | 5,328 | 1,163 | 453 |
| 2005 | 457 | 3,45,106 | – | – | – | – | 457 |
| 2006 | 553 | 3,83,983 | 1,95,803 | 7,692 | 7,496 | 1,408 | 553 |
| 2007 | 734 | 3,33,680 | 1,61,469 | 9,158 | 8,886 | 1,883 | 734 |
| 2008 | 881 | 3,25,433 | 1,67,035 | 11,669 | 11,330 | 2,136 | 881 |
| 2009 | 989 | 4,09,110 | 1,93,091 | 11,894 | 11,516 | 2,431 | 989 |
| 2010 | 1,043 | 5,47,698 | 2,69,036 | 12,271 | 11,865 | 2,589 | 1,043 |
| 2011 | 1,001 | 4,99,120 | 2,43,236 | 11,837 | 11,237 | 2,415 | 1,001 |
| 2012 | 1,091 | 5,50,080 | 2,71,442 | 12,795 | 12,190 | 2,674 | 1,091 |
UPSC CSE Statistics: Candidates Appeared in Prelims, Mains, Interview: 2013 to 2026
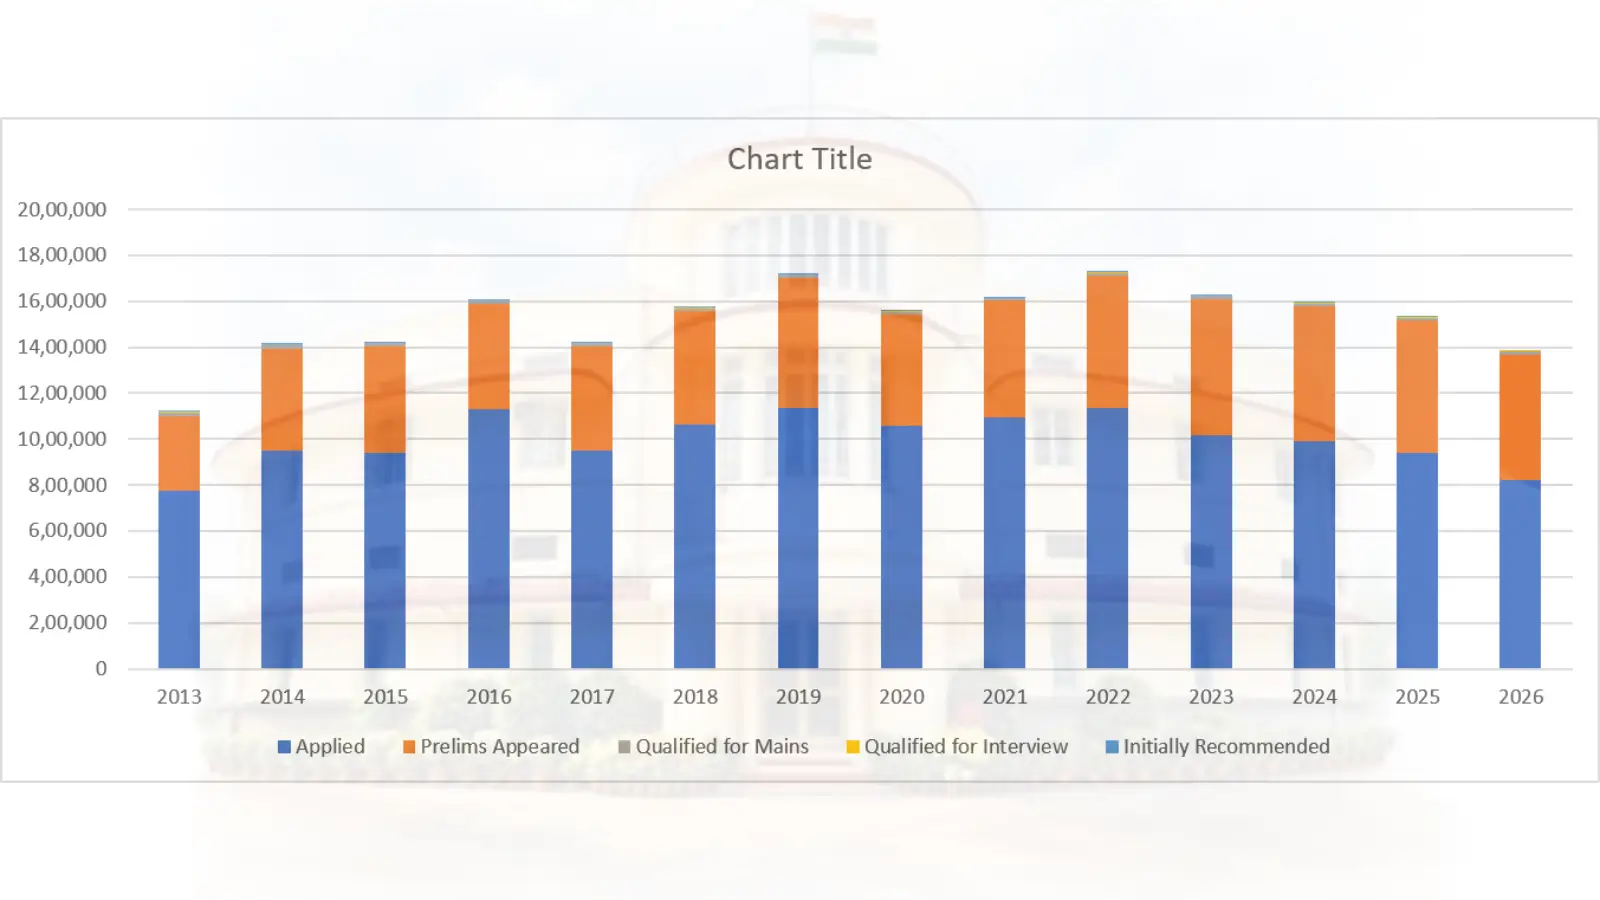
The following table provides a year-wise comparison of vacancies, applications, attendance in the Preliminary Examination, candidates qualifying for the Main Examination, Mains attendance, candidates qualifying for the Personality Test and initial final recommendations from 2013 to 2026.
| Year | Vacancies | Applied | Prelims Appeared | Qualified for Mains | Mains Appeared | Qualified for Interview | Initially Recommended |
|---|---|---|---|---|---|---|---|
| 2013 | 1,228 | 7,76,604 | 3,24,279 | 14,800 | 14,178 | 3,001 | 1,122 |
| 2014 | 1,364 | 9,47,428 | 4,46,623 | 16,933 | 16,286 | 3,308 | 1,236 |
| 2015 | 1,164 | 9,39,735 | 4,63,391 | 15,008 | 14,642 | 2,797 | 1,078 |
| 2016 | 1,209 | 11,28,262 | 4,59,659 | 15,452 | 15,149 | 2,961 | 1,099 |
| 2017 | 1,058 | 9,47,728 | 4,56,625 | 13,366 | 13,060 | 2,564 | 1,056 |
| 2018 | 812 | 10,65,552 | 4,93,972 | 10,468 | 10,246 | 1,994 | 759 |
| 2019 | 927 | 11,35,261 | 5,68,282 | 11,845 | 11,474 | 2,306 | 829 |
| 2020 | 836 | 10,56,835 | 4,86,952 | 10,534 | 10,343 | 2,049 | 761 |
| 2021 | 749 | 10,93,984 | 5,08,619 | 9,214 | 8,930 | 1,824 | 685 |
| 2022 | 1,022 | 11,35,697 | 5,73,735 | 13,090 | – | 2,529 | 933 |
| 2023 | 1,143 | 10,16,850 | 5,92,141 | 14,624 | – | 2,916 | 1,016 |
| 2024 | 1,129 | 9,92,599 | 5,83,213 | 14,627 | – | 2,845 | 1,009 |
| 2025 | 1,087 | 9,37,876 | 5,76,793 | 14,161 | – | 2,736 | 958 |
| 2026 | 1,016 | 8,19,732 | 5,49,000 | 13,343 | – | 2,526 | – |
Official Government Sources
- PIB: Civil Services Examination 2013 – Final Result.
- UPSC Annual Report 2015–16 – CSE 2014.
- UPSC Annual Report 2016–17 – CSE 2015.
- PIB: CSE 2016 – Final Result.
- PIB: CSE 2018 – Examination Highlights.
- UPSC Annual Report 2022–23 – CSE 2021.
- UPSC Annual Reports – Official Archive.
- Union Public Service Commission.
- UPSC Annual Reports.
- Department of Personnel and Training.
- Press Information Bureau, Government of India.
Sources: PIB result announcements and UPSC Annual Reports.
Press Information Bureau
A data-quality warning: There are discrepancies between some UPSC Annual Report tables and PIB announcements. For example, the 2016 Annual Report profile records 11,28,262 applications, whereas the PIB result highlights state 11,35,943. The 2015 report also contains slightly different application and attendance figures in its main text and detailed appendix. These should be documented rather than silently mixed.
What Do the Different UPSC Examination Statistics Mean?
1. Number of Vacancies
This refers to the number of posts reported by the Government for recruitment through a particular Civil Services Examination. The number may change following revisions in requisitions.
2. Number of Candidates Applied
This represents the total number of candidates who submitted applications for the Preliminary Examination.
3. Number of Candidates Appeared in Prelims
This represents the candidates who actually appeared in the Preliminary Examination, rather than merely registering for it.
4. Number of Candidates Qualified for Mains
These are candidates declared successful in the Preliminary Examination and eligible to participate in the written Main Examination.
5. Number of Candidates Appeared in Mains
This represents candidates who actually appeared in the Civil Services Main Examination. It should not be confused with the number of candidates declared successful in Prelims.
6. Number of Candidates Qualified for Interview
These are candidates shortlisted for the Personality Test after evaluation of their Main Examination performance.
7. Number of Candidates Finally Recommended
This represents candidates recommended by UPSC for appointment to the various services based on their performance and the applicable vacancies.
How Competitive Is the UPSC Civil Services Examination?
The competition can be understood through the proportion of candidates progressing from one stage to another.
Prelims Attendance Rate
Prelims Attendance Rate = (Candidates Appeared in Prelims / Candidates Applied) × 100
Prelims Qualification Rate
Prelims Qualification Rate = (Candidates Qualified for Mains / Candidates Appeared in Prelims) × 100
Mains-to-Interview Qualification Rate
Mains-to-Interview Rate = (Candidates Qualified for Interview / Candidates Appeared in Mains) × 100
Overall Selection Rate
Overall Selection Rate = (Candidates Finally Recommended / Candidates Appeared in Prelims) × 100
Important Observations and Trends
The historical data can help identify changes in the scale of the examination, the number of applicants, attendance patterns and recruitment requirements.
- The number of applications and the number of candidates actually appearing are different measures.
- The number of vacancies varies considerably from year to year.
- Not every candidate who qualifies Prelims necessarily appears in Mains.
- The number of candidates recommended in the initial final result may differ from the eventual recommendations after reserve-list operations.
- The overall selection rate should be calculated using actual attendance, rather than total applications.
Frequently Asked Questions
1. How many candidates apply for UPSC Civil Services Examination every year?
The number varies by examination year. In recent years, applications have generally been around 10 lakh or more, although the 2024 examination received 9,92,599 applications.
2. How many candidates actually appear in UPSC Prelims?
The number varies annually. In 2024, 5,83,213 candidates appeared in the Preliminary Examination.
3. How many candidates qualify for UPSC Mains?
The number depends on the examination year and the applicable selection criteria. In 2024, 14,627 candidates qualified for the Main Examination.
4. How many candidates are called for the UPSC Interview?
The number varies annually. In 2024, 2,845 candidates qualified for the Personality Test.
5. How many candidates are finally selected in UPSC CSE?
The number depends on the vacancies reported by the Government and the final recommendations made by UPSC. In the 2024 examination, 1,009 candidates were initially recommended.
6. Are vacancies and final recommendations always equal?
No. The number of candidates recommended may be lower than the vacancies reported. Reserve-list recommendations and subsequent recruitment decisions may also affect the final position.
7. Where can official UPSC examination statistics be found?
UPSC Annual Reports, official examination notifications, final-result press releases and Department of Personnel and Training statistical publications are useful primary government sources.
Official Sources and References
UPSC Preparation Resources
Explore structured study materials, syllabus topics, practice questions and preparation resources.
UPSC Preparation
Everything you need to begin your Civil Services journey.
UPSC Prelims
Prepare for General Studies Paper I and CSAT.
UPSC Mains
Complete resources for descriptive examination preparation.
Study Resources
Study materials, practice questions and revision resources.
General Studies
Explore structured study materials, syllabus topics, practice questions and preparation resources.
GS Paper I
Indian Heritage, History, Geography and Society.
GS Paper II
Constitution, Governance, Social Justice and International Relations.
GS Paper III
Economy, Agriculture, Science, Environment and Security.
GS Paper IV
Ethics, Integrity, Aptitude and Case Studies.
Latest Articles
The Union Public Service Commission (UPSC) Civil Services Examination is one of India’s most competitive recruitment examinations. Every year, several … Read More »

What is the UPSC CSE – Civil Services Examination? The UPSC CSE (Civil Services Examination) is conducted every year by … Read More »

This page contains UPSC History Optional PYQ 2026 Paper I and II from UPSC Civil Services Main Examination 2026. Also … Read More »

Previous year question papers (PYQs) are among the most important resources for preparing for the History Optional subject in the … Read More »
Modern Indian History
View All
The Government of India Act 1853, commonly known as the Charter Act of 1853, was passed by the British Parliament … Read More »

The Charter Act 1833 or the Charter Act of 1833, also known as Saint Helena Act of 1833, was one … Read More »

The Charter Act 1813 or the Charter Act of 1813 was an important British parliamentary legislation that renewed the East … Read More »

The Charter Act 1793, officially known as officially the East India Company Act 1793, was an important British parliamentary legislation that … Read More »
Indian Polity
View All
Anoop Baranwal vs Union of India (2023) is one of the most important Supreme Court judgments for understanding the appointment … Read More »

T.N. Seshan was the tenth Chief Election Commissioner of India and one of the most influential figures in the history … Read More »

Sukumar Sen was the first Chief Election Commissioner of India and one of the most important figures in the early … Read More »

The Chief Election Commissioner (CEC) is the head of the Election Commission of India. Since the establishment of the Election … Read More »